Quick Start
This section provides example runs of the serialization and deserialization processes. All example files can be found in the GitHub repository of FAIRLinked under resources or can be directly accessed here. Command-line version of the functions below can be found here and in the change log.
Serializing and deserializing with RDFTableConversion
To start serializing with FAIRLinked, we first make a template using jsonld_template_generator from FAIRLinked.RDFTableConversion.csv_to_jsonld_mapper. In your CSV, make sure to have some (possibly empty or partially filled) rows reserved for metadata about your variable.
Note
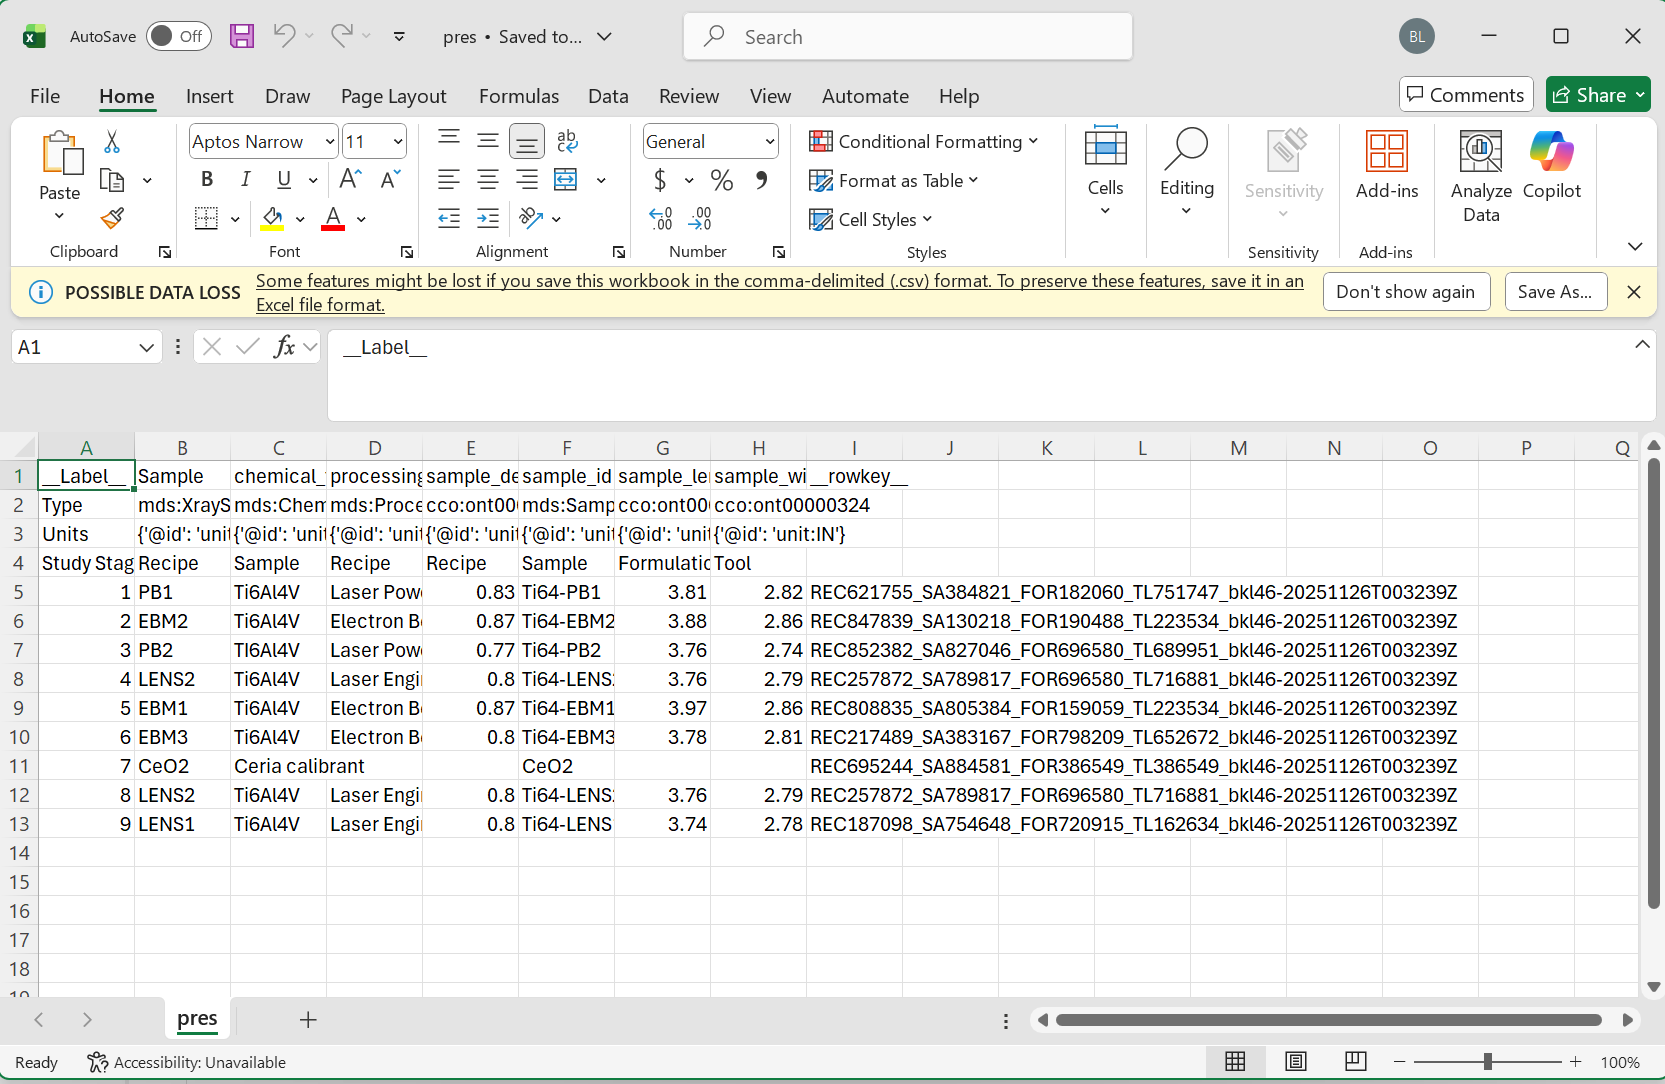
Please make sure to follow the proper formatting guidelines for input CSV file:
Each column name should be the “common” or alternative name for this object.
The following three rows should be reserved for the type, units, and study stage in that order.
If values for these are not available, the space should be left blank.
Data for each sample can then begin on the 5th row.
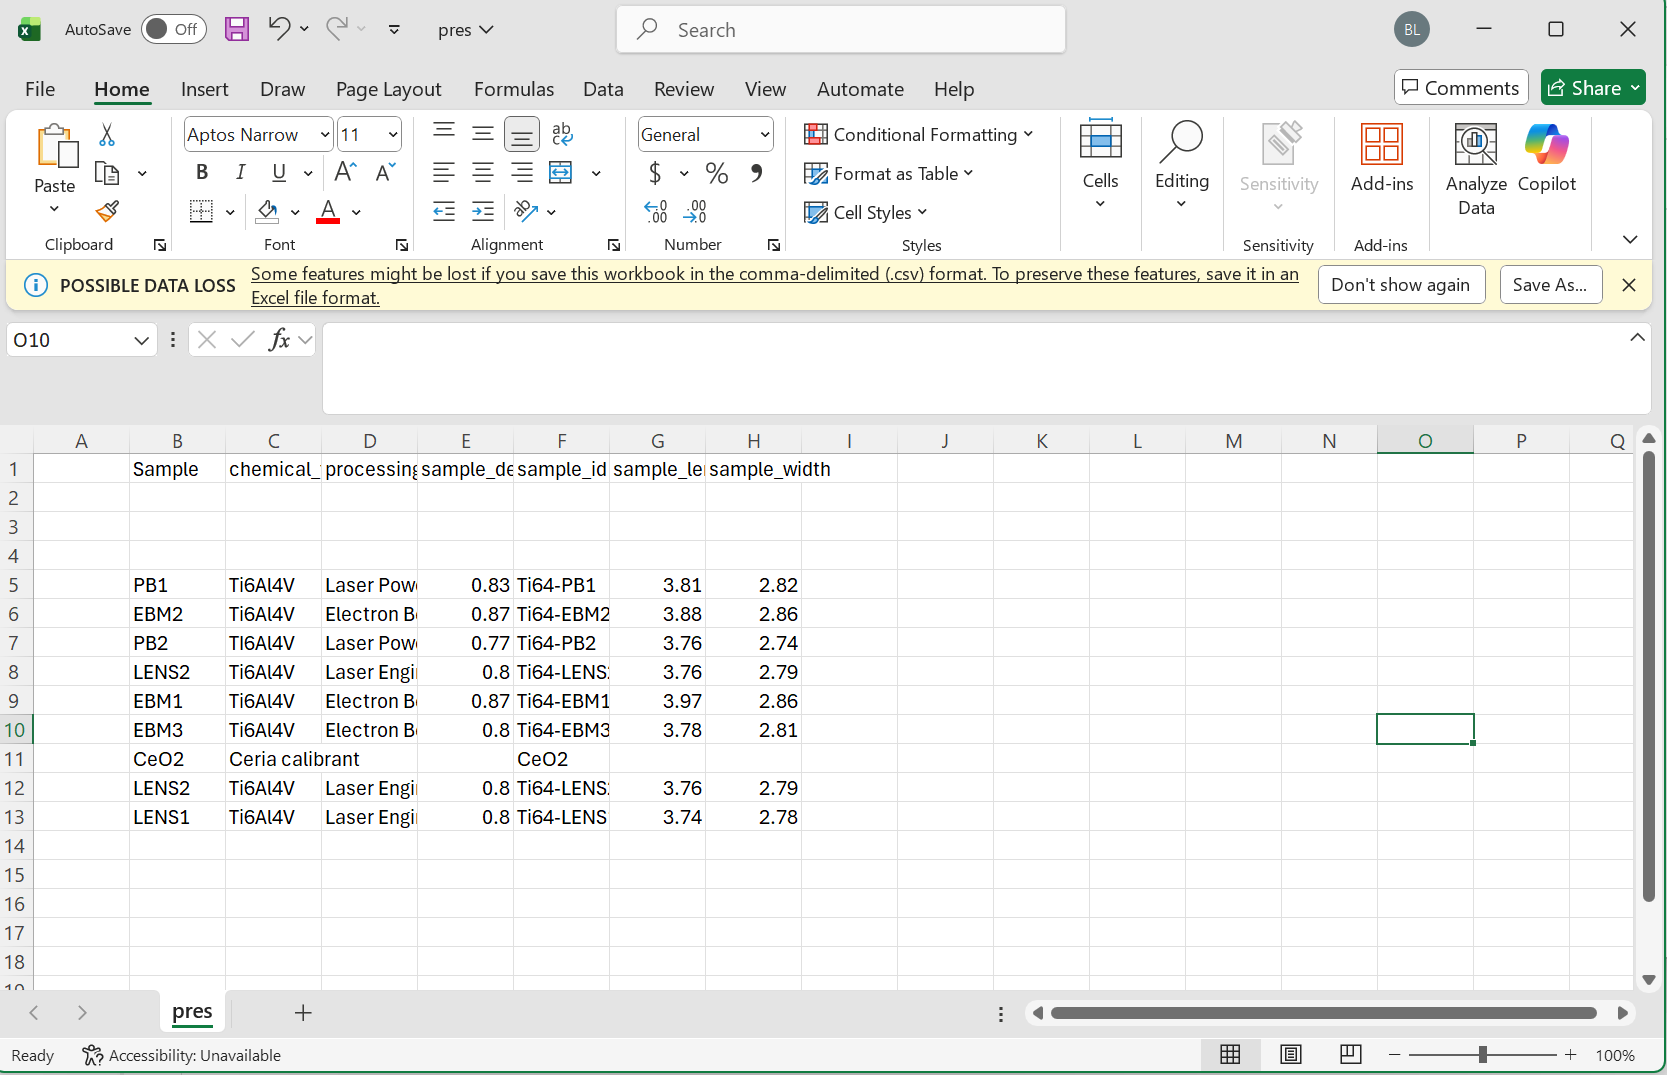
Please see the following images for reference:
Full Table
Minimum Viable Data
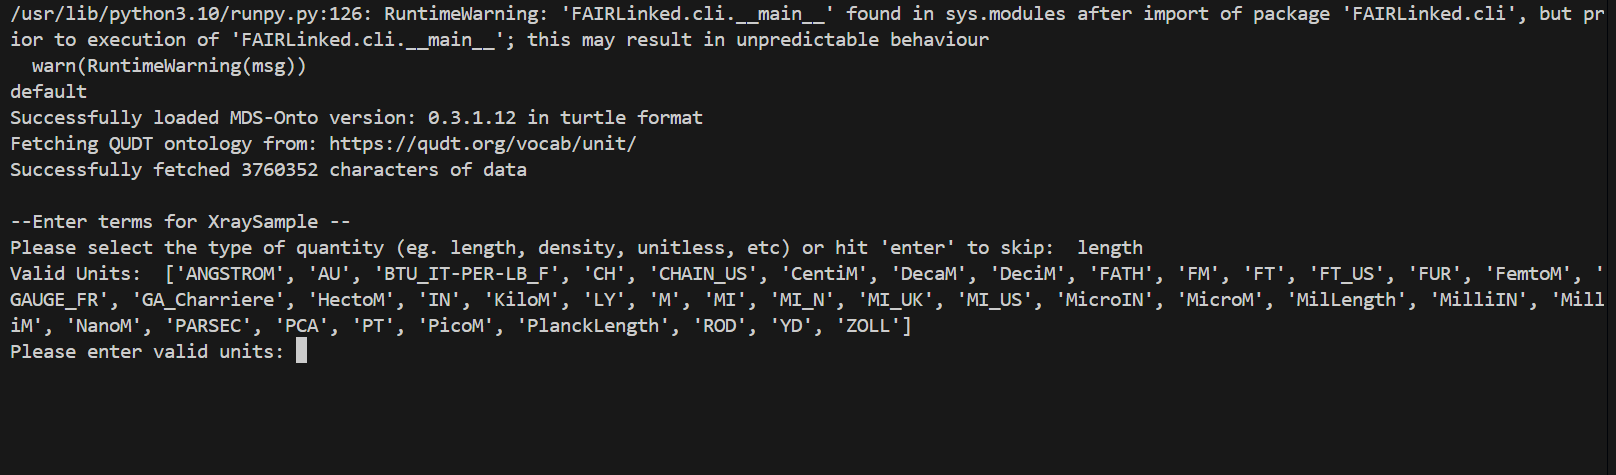
During the template generating process, the user may be prompted for data for different columns. When no units are detected, the user will be prompted for the type of unit, and then given a list of valid units to choose from.
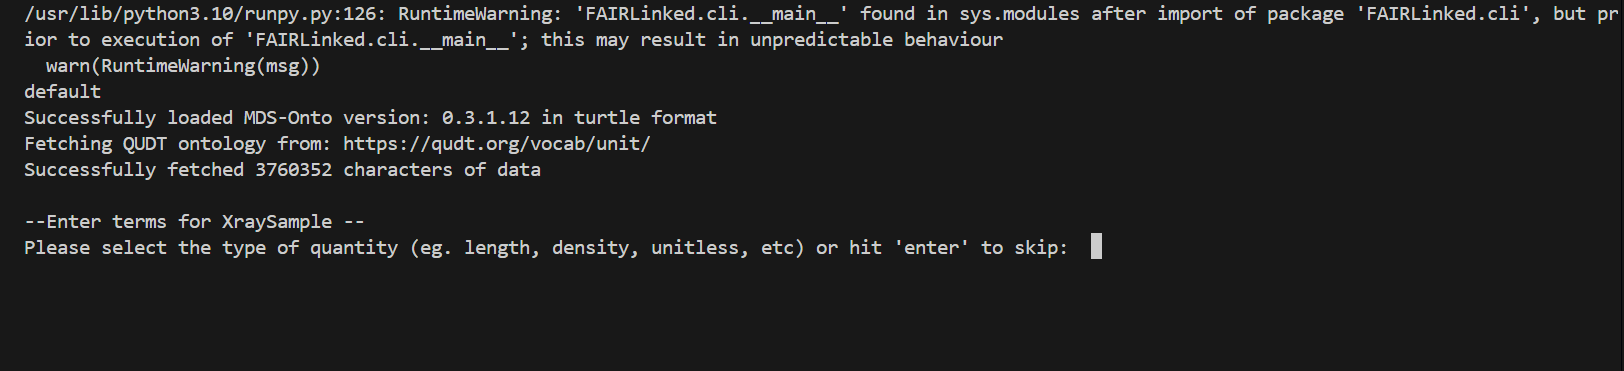
When no study stage is detected, the user will similarly be given a list of study stages to choose from.
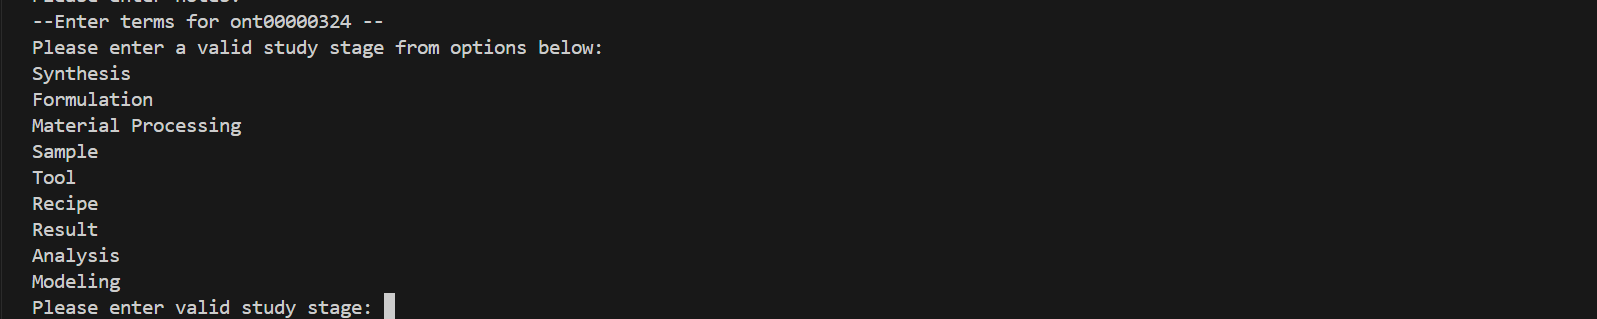
The user will automatically be prompted for optional notes for each column.
IN THIS FIRST EXAMPLE, we will use the microindentation data of a PMMA, or Poly(methyl methacrylate), sample.
from FAIRLinked.InterfaceMDS.load_mds_ontology import load_mds_ontology_graph
from FAIRLinked.RDFTableConversion.csv_to_jsonld_mapper import jsonld_template_generator

mds_graph = load_mds_ontology_graph()

jsonld_template_generator(csv_path="resources/worked-example-RDFTableConversion/microindentation/sa17455_00.csv",
                           ontology_graph=mds_graph,
                           output_path="resources/worked-example-RDFTableConversion/microindentation/output_template.json",
                           matched_log_path="resources/worked-example-RDFTableConversion/microindentation/microindentation_matched.txt",
                           unmatched_log_path="resources/worked-example-RDFTableConversion/microindentation/microindentation_unmatched.txt",
                           skip_prompts=False)
The template is designed to capture the metadata associated with a variable, including units, study stage, row key, and variable definition. If the user does not wish to go through the prompts, set skip_prompts to True.
After creating the template, run extract_data_from_csv using the template and CSV input to create JSON-LDs filled with data instances.
from FAIRLinked.RDFTableConversion.csv_to_jsonld_template_filler import extract_data_from_csv
import json
from FAIRLinked.InterfaceMDS.load_mds_ontology import load_mds_ontology_graph

mds_graph = load_mds_ontology_graph()

with open("resources/worked-example-RDFTableConversion/microindentation/output_template.json", "r") as f:
    metadata_template = json.load(f)

prop_col_pair_dict = {"is about": [("PolymerGrade", "Sample"),
                                    ("Hardness (GPa)", "Sample"),
                                    ("VickersHardness", "YoungModulus"),
                                    ("Load (Newton)", "Measurement"),
                                    ("ExposureStep","Measurement"),
                                    ("ExposureType","Measurement"),
                                    ("MeasurementNumber","Measurement")]}

extract_data_from_csv(metadata_template=metadata_template,
                      csv_file="resources/worked-example-RDFTableConversion/microindentation/sa17455_00.csv",
                      orcid="0000-0001-2345-6789",
                      output_folder="resources/worked-example-RDFTableConversion/microindentation/test_data_microindentation/output_microindentation",
                      row_key_cols=["Measurement", "Sample"],
                      id_cols=["Measurement", "Sample"],
                      prop_column_pair_dict=prop_col_pair_dict,
                      ontology_graph=mds_graph)
The arguments row_key_cols, id_cols, prop_column_pair_dict, and ontology_graph are all optional. row_key_cols identifies columns used to create row keys, while id_cols specify identifiers of unique entities. prop_column_pair_dict defines the object or data properties used in the RDF graph.
To view the list of properties in MDS-Onto:
from FAIRLinked.InterfaceMDS.load_mds_ontology import load_mds_ontology_graph
from FAIRLinked.RDFTableConversion.csv_to_jsonld_template_filler import generate_prop_metadata_dict

mds_graph = load_mds_ontology_graph()
view_all_props = generate_prop_metadata_dict(mds_graph)

for key, value in view_all_props.items():
    print(f"{key}: {value}")
To deserialize your data, use jsonld_directory_to_csv:
from FAIRLinked.RDFTableConversion.jsonld_batch_converter import jsonld_directory_to_csv

jsonld_directory_to_csv(input_dir="resources/worked-example-RDFTableConversion/microindentation/test_data_microindentation/output_microindentation",
                        output_basename="sa17455_00_microindentation",
                        output_dir="resources/worked-example-RDFTableConversion/microindentation/test_data_microindentation/output_deserialize_microindentation")
Serializing and deserializing using RDF Data Cube with QBWorkflow
The RDF Data Cube Workflow is better run in bash.
$ FAIRLinked data-cube-run
This will start a series of prompts:
Welcome to FAIRLinked RDF Data Cube 🚀
Do you have an existing RDF data cube dataset? (yes/no): no
Answer ‘yes’ to deserialize. If ‘no’, you will be asked if you are running an experiment:
Are you running an experiment now? (yes/no): yes
Once you’ve answered ‘yes’, provide the ontology files:
Do you have these ontology files (lowest-level, MDS combined)? (yes/no): yes
Enter the path to the Lowest-level MDS ontology file: resources/worked-example-QBWorkflow/test_data/Final_Corrected_without_DetectorName/Low-Level_Corrected.ttl
Enter the path to the Combined MDS ontology file: resources/worked-example-QBWorkflow/test_data/Final_Corrected_without_DetectorName/MDS_Onto_Corrected.ttl
This will generate a template at resources/worked-example-QBWorkflow/test_data/Final_Corrected_without_DetectorName/data_template.xlsx.
To serialize, start the workflow again and provide the following paths:
Enter ORC_ID: 0000-0001-2345-6789
Enter the path to the namespace Excel file: resources/worked-example-QBWorkflow/test_data/Final_Corrected_without_DetectorName/namespace_template.xlsx
Enter the path to the data Excel file: resources/worked-example-QBWorkflow/test_data/Final_Corrected_without_DetectorName/mock_xrd_data.xlsx
Enter the path to the output folder: resources/worked-example-QBWorkflow/test_data/Final_Corrected_without_DetectorName/output_serialize
Choose the conversion mode:
Do you want to convert the entire DataFrame as one dataset or row-by-row? (entire/row-by-row): row-by-row
Finally, select your row identifiers:
The following columns appear to be identifiers (contain 'id' in their name):
Include column 'ExperimentId' in the row-based dataset naming? (yes/no): yes
Include column 'DetectorWidth' in the row-based dataset naming? (yes/no): no
Approved ID columns for naming: ['ExperimentId']
Conversion completed under mode='row-by-row'.
To deserialize, answer ‘yes’ to the first question and provide the paths to your JSON-LD folder and output directory.